Reporting
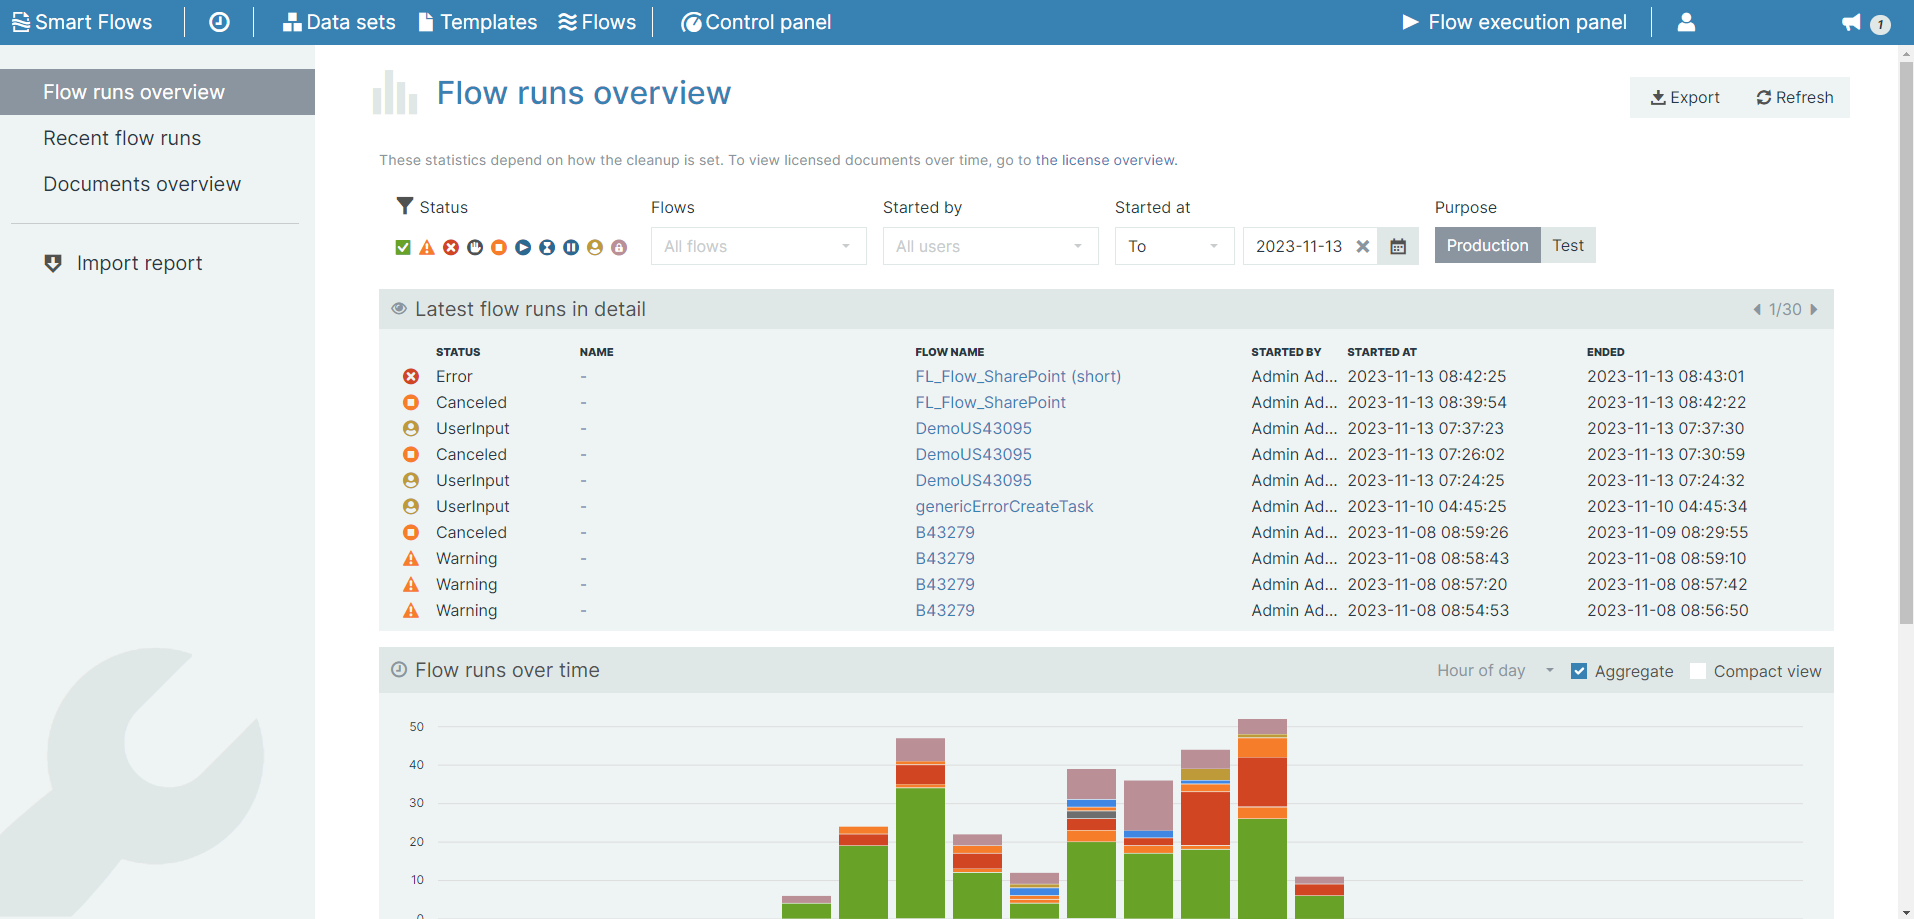
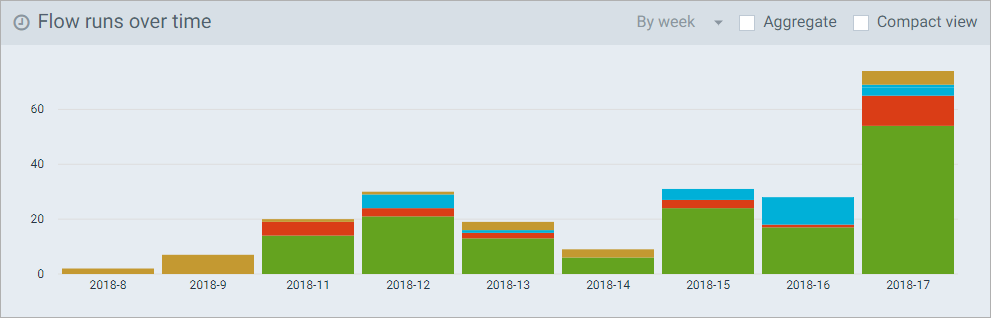
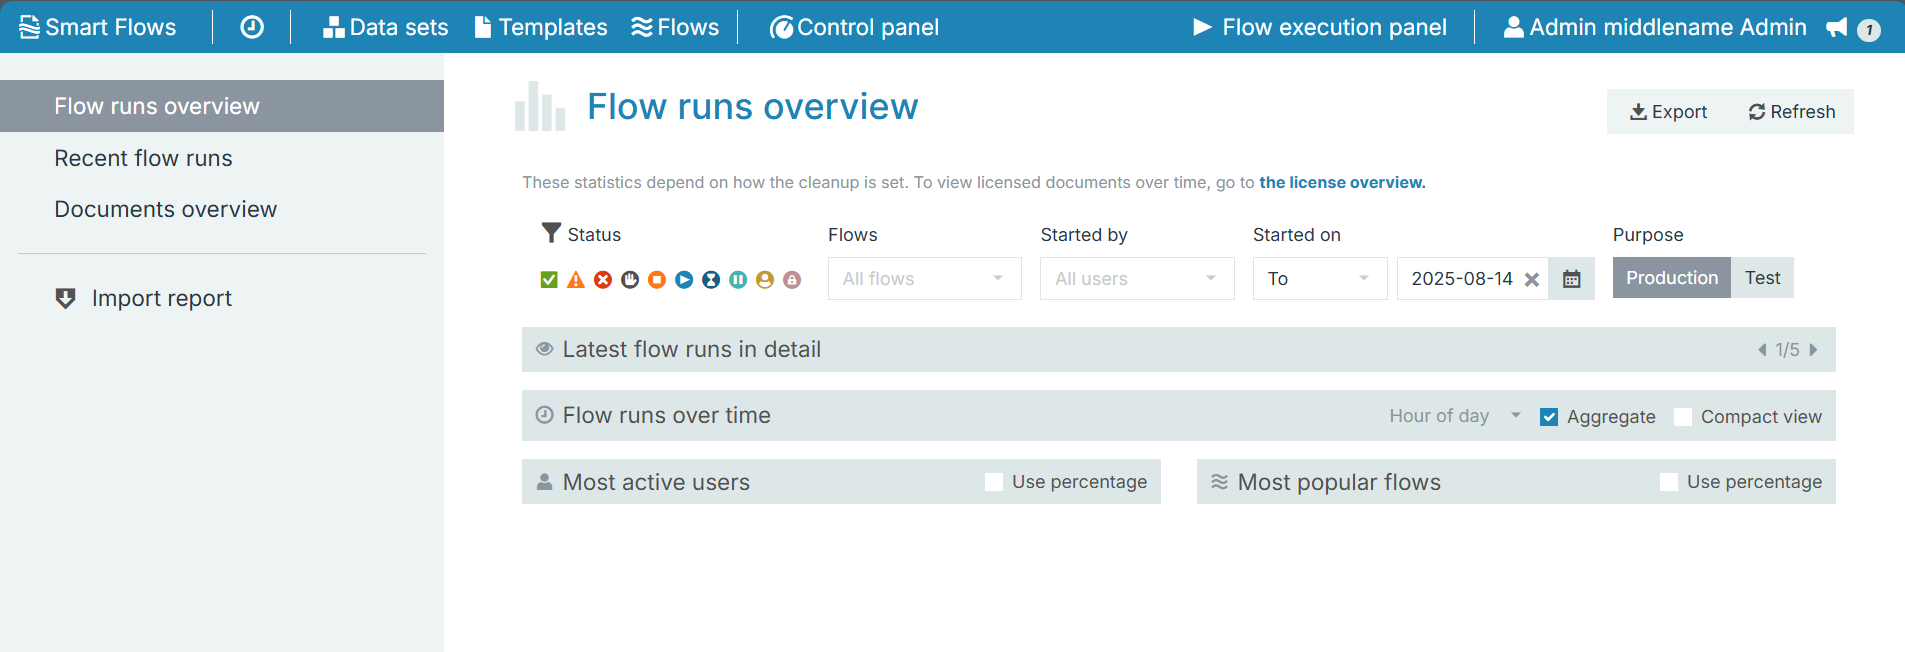
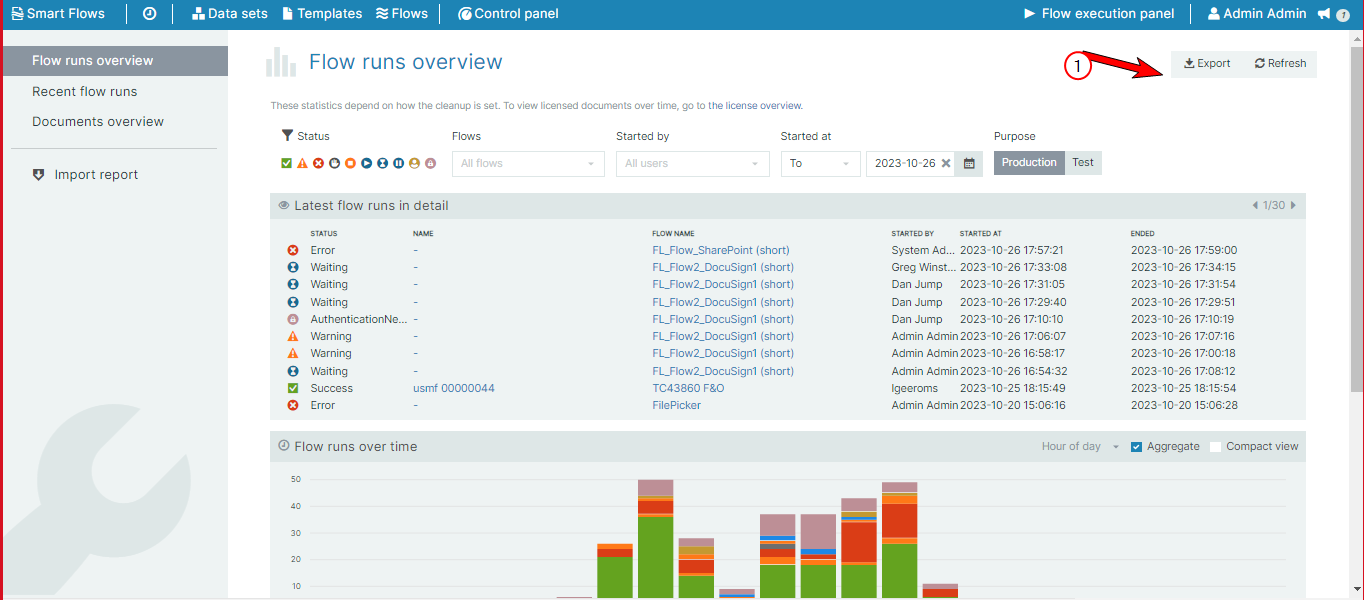
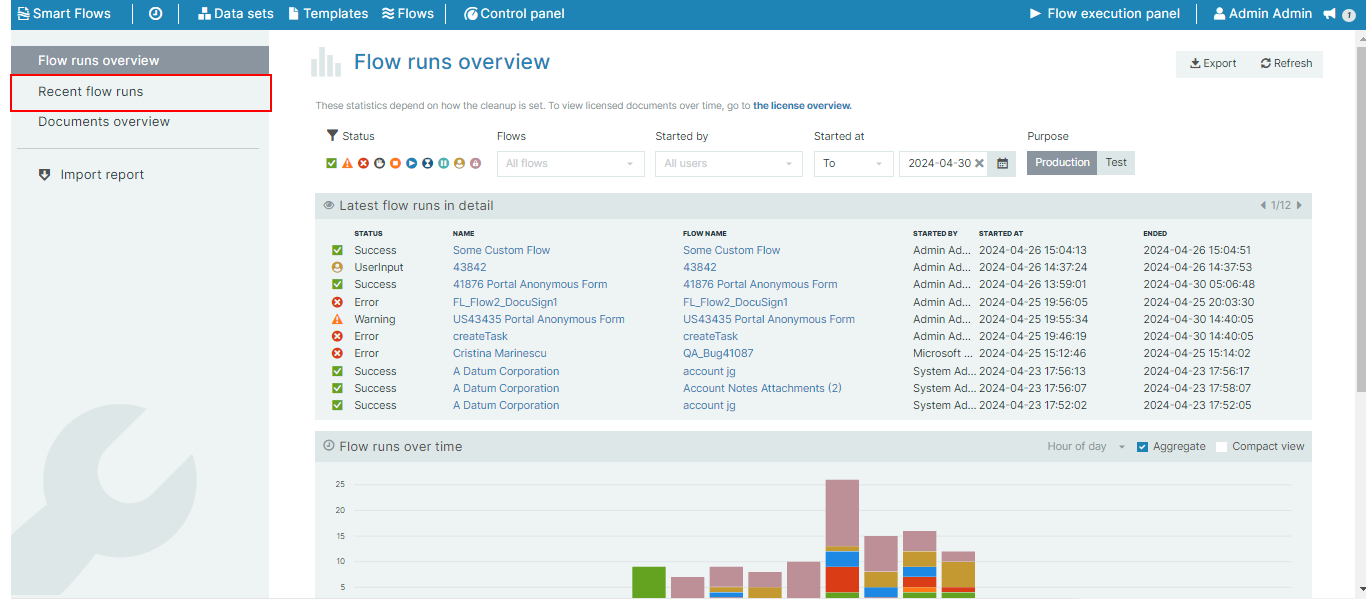
Smart Flows comes with a Reporting dashboard that provides an overview of the flow's statistics. Reporting helps administrators to analyze which flows are the most popular and which are causing problems. For instance, here's a chart that shows the number of flow runs per day for the last month, with red representing flows that failed.
Latest Flow Runs in Detail
-
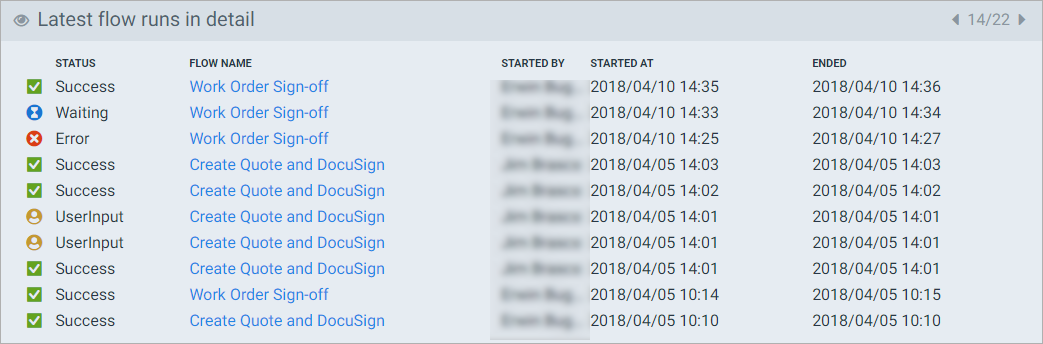
The Latest flow runs in detail dashboard provides an basic details of all the flows. This includes flow name, user who has initiated the flow, start and end time of the flow, and flow status.
-
You can navigate to different pages to view the flow as the dashboard displays 10 flows in each page

-
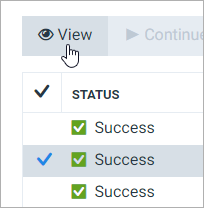
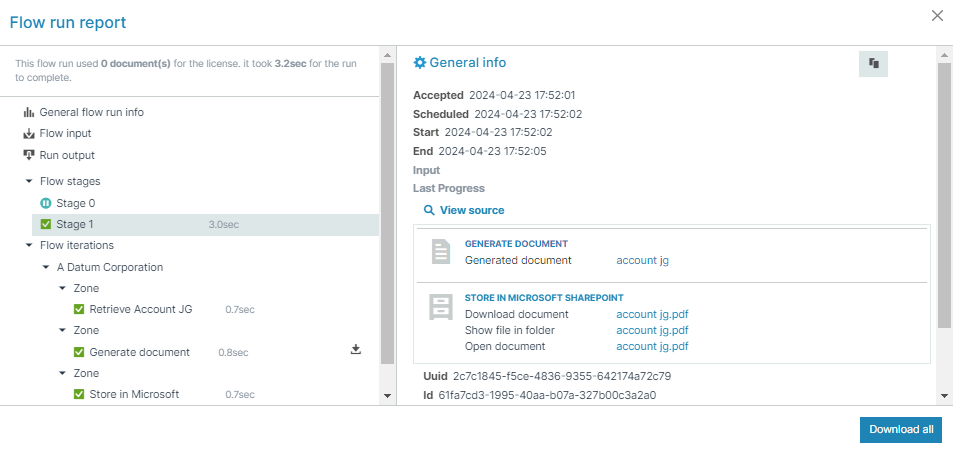
Select the Flow name to view a dialog box displaying end-to-end details of the flow. This includes information such as generated document, flow ID, flow status, slow stages, and flow output.
-
Select Download to download a JSON file containing all the information about the flow run. This also includes invaluable information for the support team to troubleshoot and determine the root cause.
-
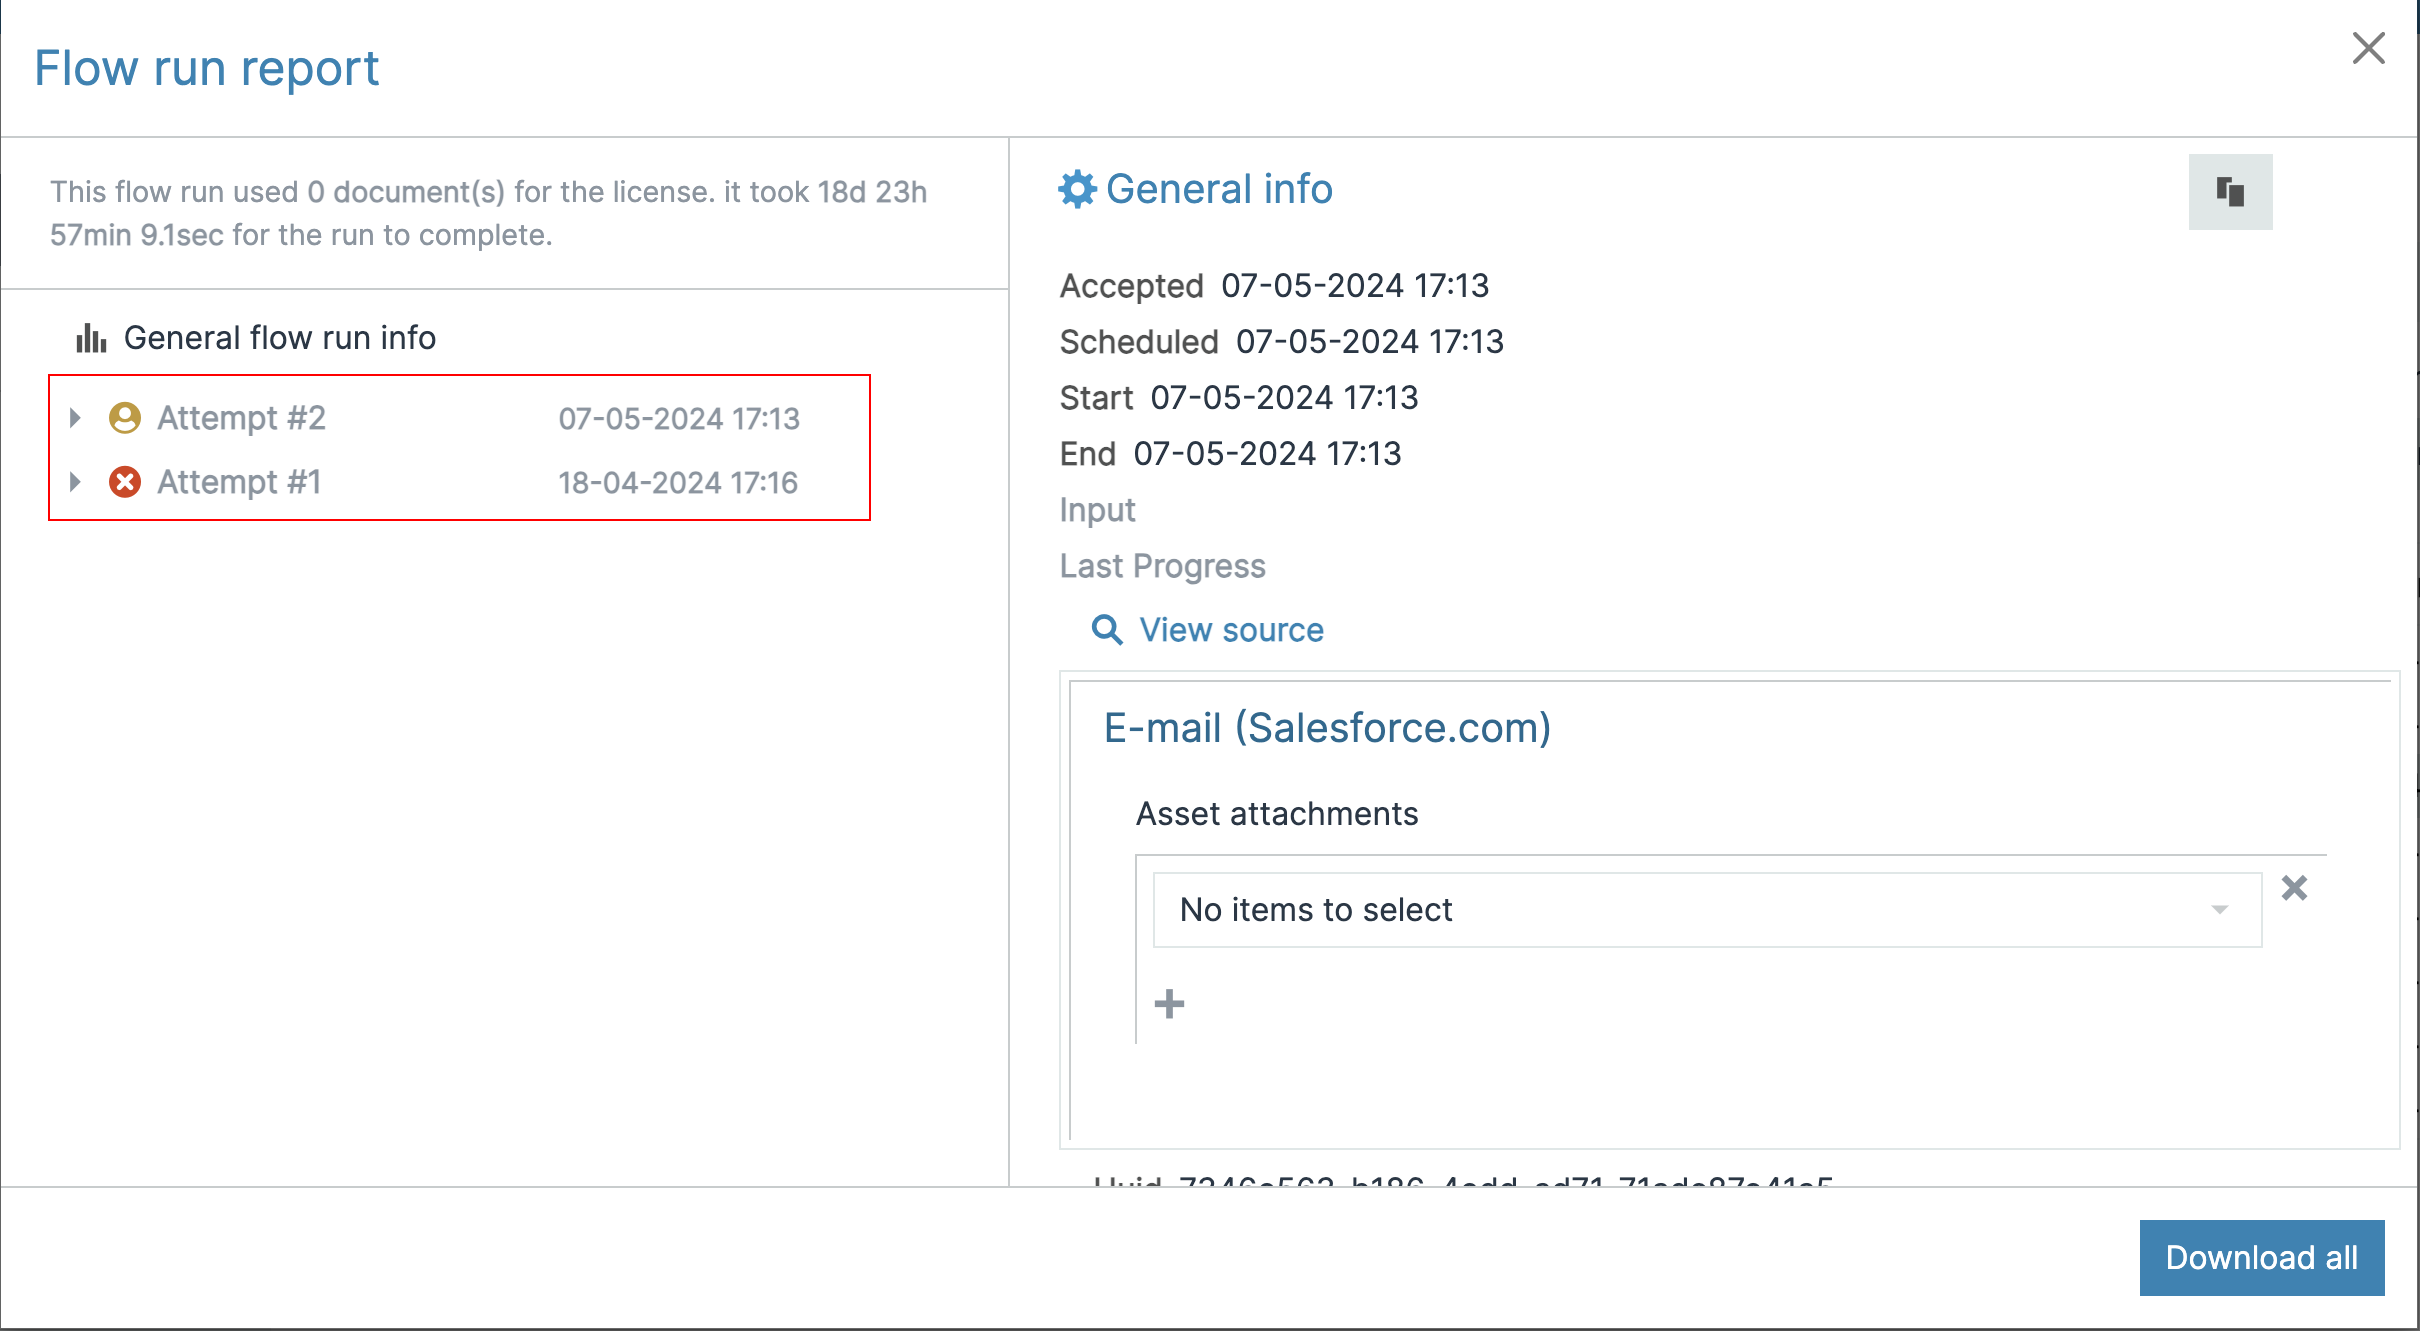
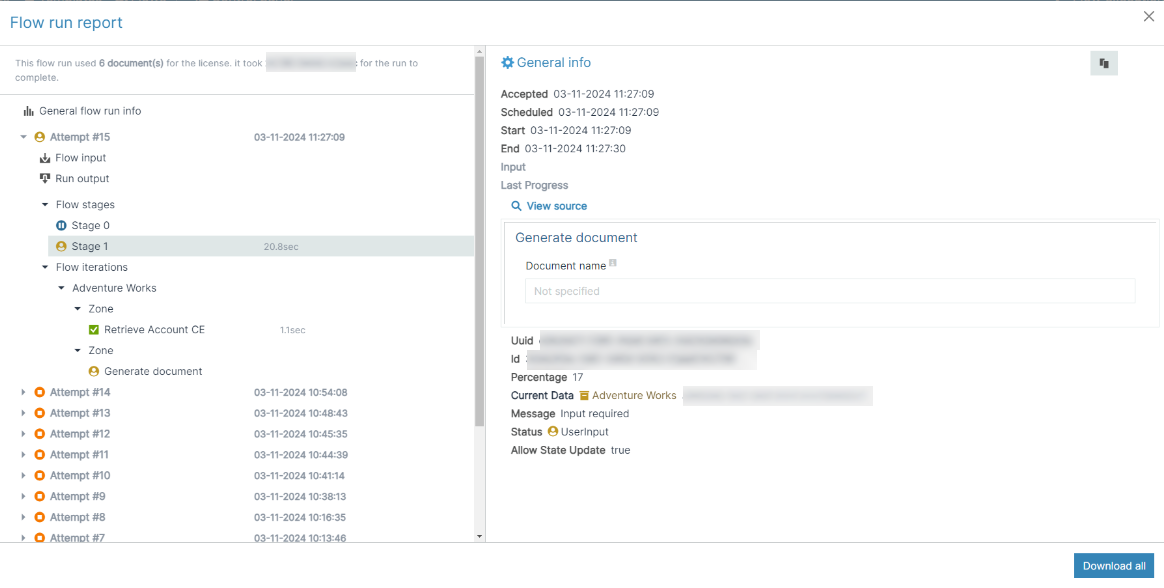
The Flow run report dialog shows all the previous iterations as well as the current run.
Flow runs over time
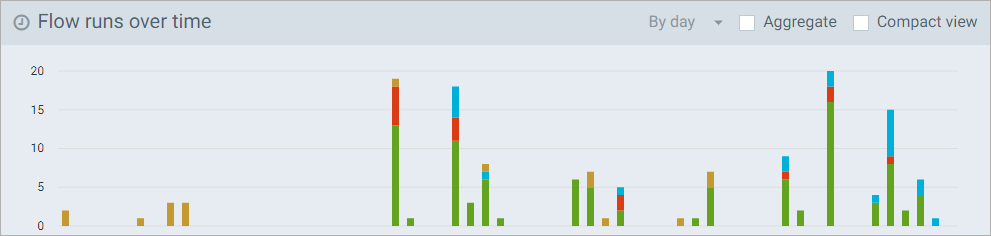
The flow runs over time tab displays a bar chart of the flow runs over time. The flow runs are color-coded according to the status of the flow run.
You can use the filtering options to get the view described in the table below.
|
Field |
Description |
||||
|---|---|---|---|---|---|
|
Time (Hours per day) |
Displays flow runs based on time intervals. The drop-down displays 5 options: Hours per day, Day of Week, Day of Month, Week of year, and Month of year.
|
||||
|
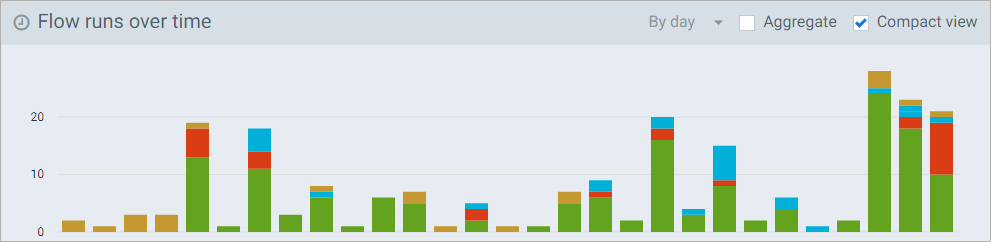
Compact view |
Displays the graph omitting the empty space. The second chart can show more data because it saves space by omitting empty spaces.
|
||||
|
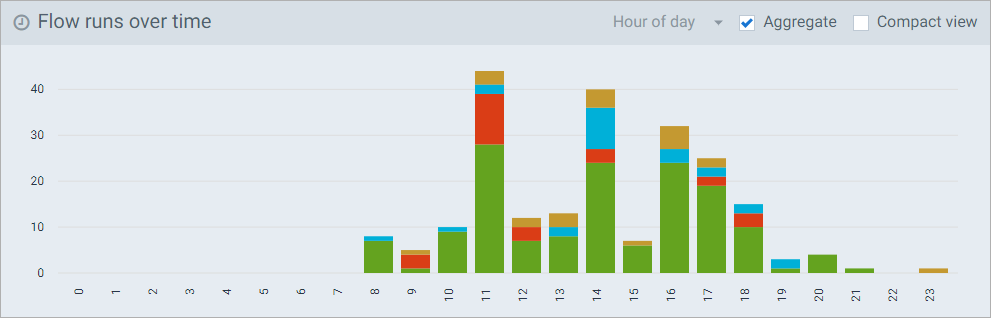
Aggregate |
Aggregate helps determine peak periods. It groups the flow runs at a specific time together. For instance, all flow runs on Monday, or all flow runs at 10 am. When you check Aggregate, the display options change from hour, day, week, and month to hour of day, day of week, day of month, week of year, and month of year.
Some conclusions we can derive from this chart:
|
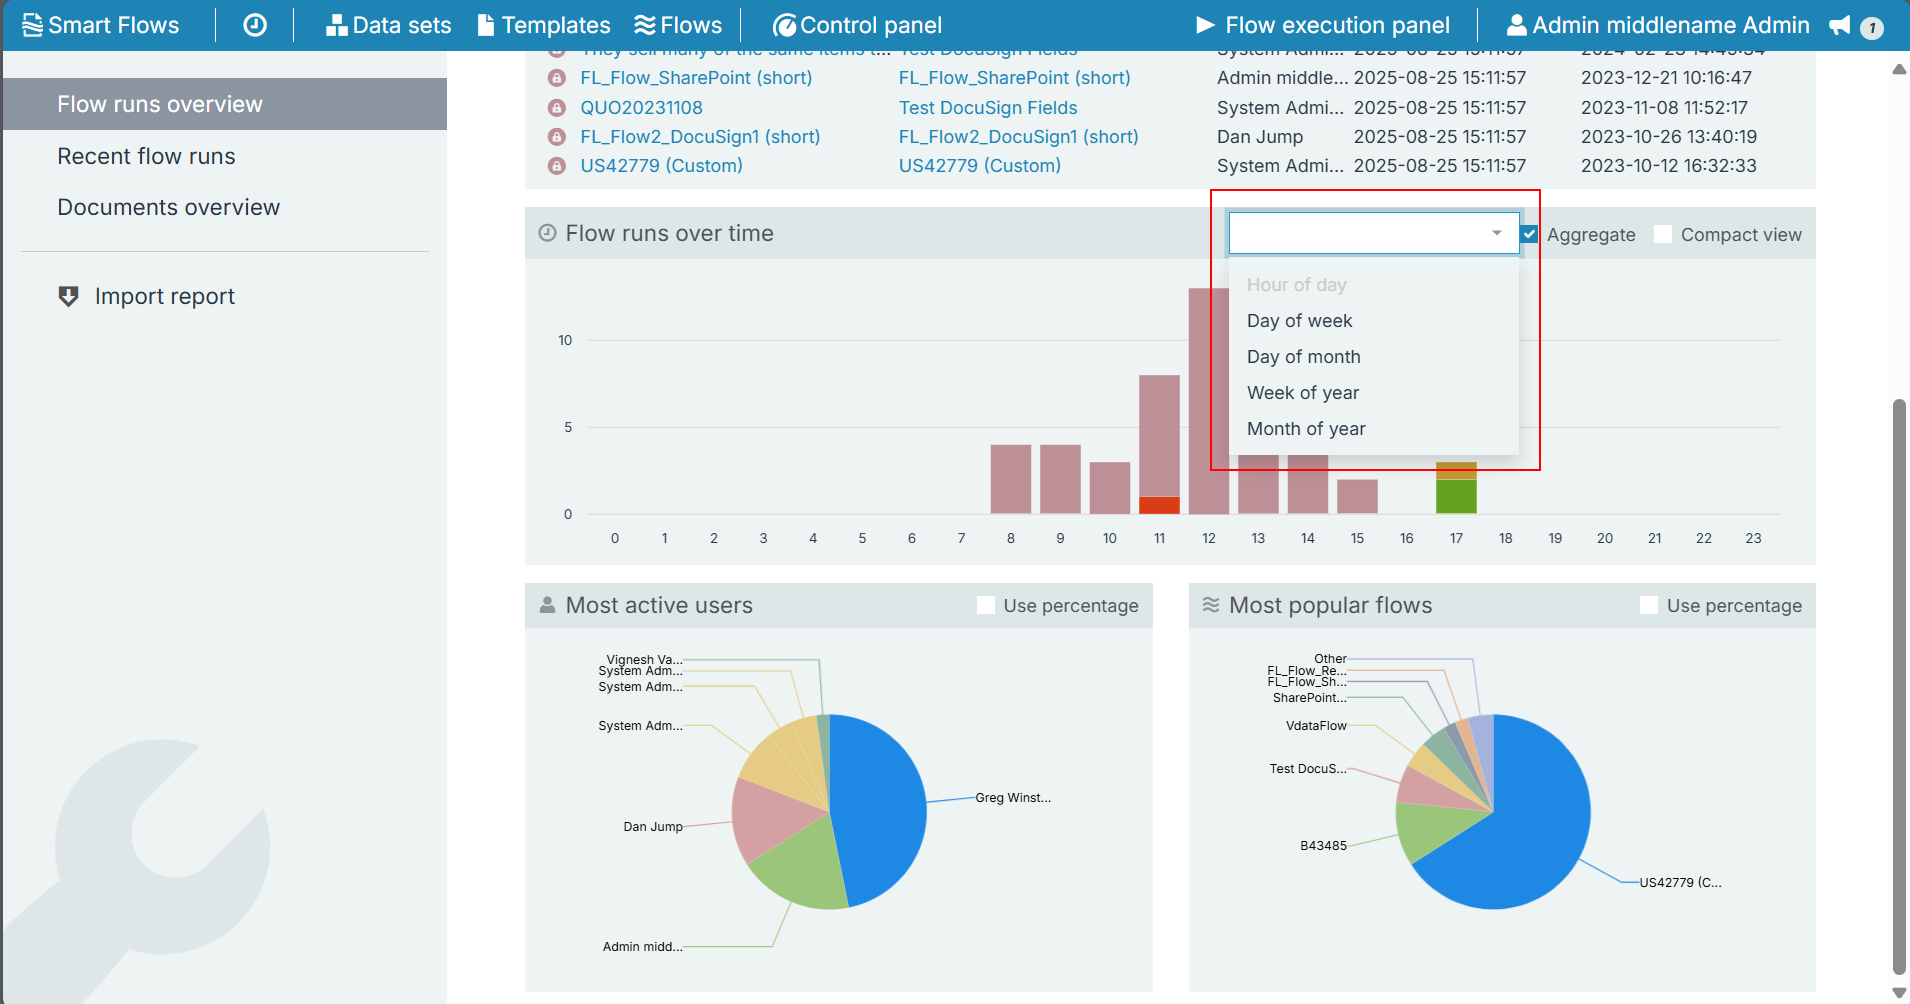
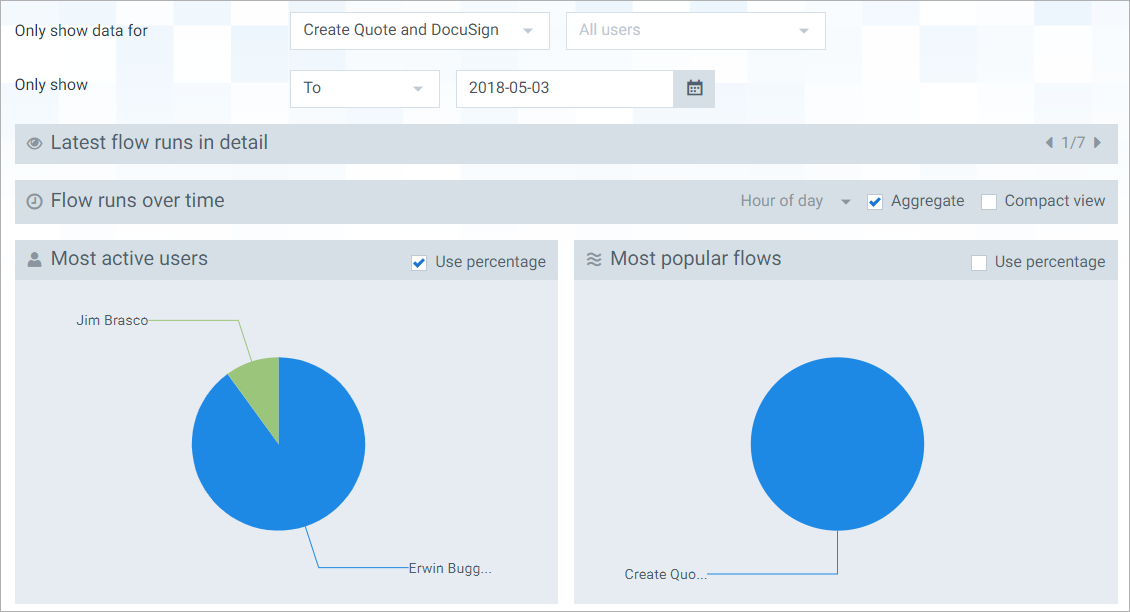
The Most active users tab displays a pie chart that shows every user's share of total flow runs.
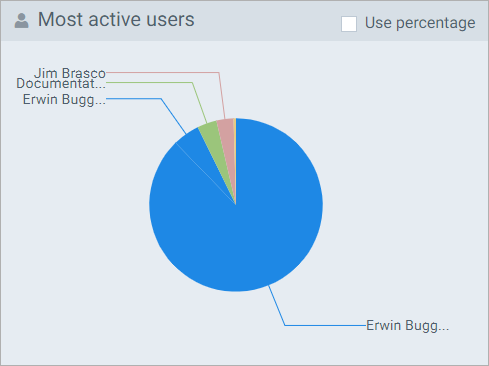
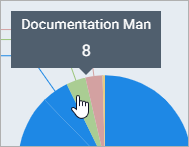
Hover over a segment to see the total number of flow runs for that user.
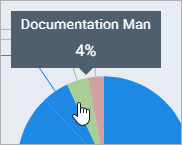
Select Use percentage checkbox to see the percentage of flows for that user compared to the total number of flows.
The Most popular flows tab displays a pie chart that shows every flow's share of total flow runs.
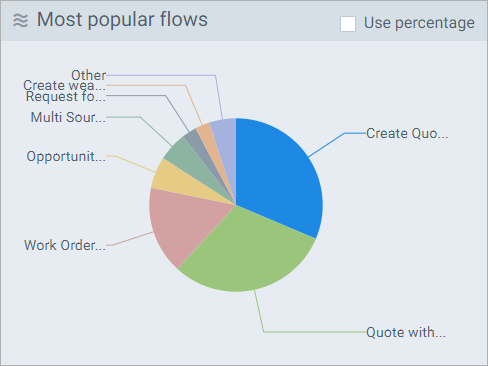
The controls are the same as Most active users. Hover over a segment to see the total number of flow runs for that flow. Select the Use percentage checkbox to get the number as a percentage.
Filters
You can filter all the data shown on the Reporting page by using the filter controls at the top.
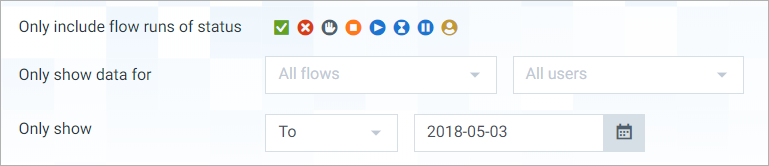
You can filter data in three ways, or any combination of them:
-
Only show flow runs of a certain status
-
Only show data for a certain flow/user
-
Only include flow runs from a certain period
To only show flow runs of a certain status, select the statuses you don't want to include:

|
all flow runs included |

|
interrupted, canceled and running flow runs omitted from the data. |
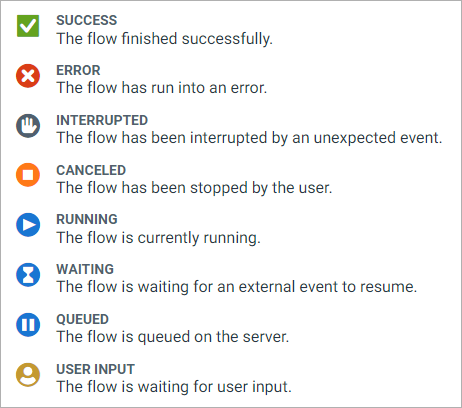
The flow detail view's Runs tab has more information about the statuses.
To only show data for a certain flow or user, select the flow or user in the dropdown menu.
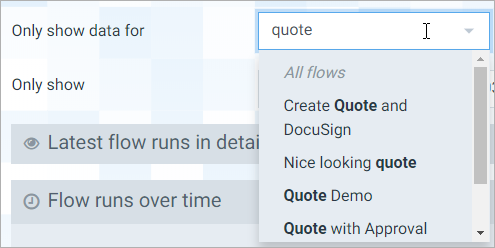
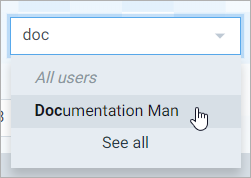
Naturally, restricting the data to a certain flow or user will make one of these pie charts obsolete.
To only include flow runs from a certain period, use the controls at the top. The first dropdown box asks you to select From, To, or Between.
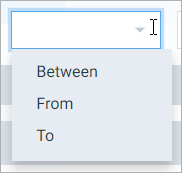
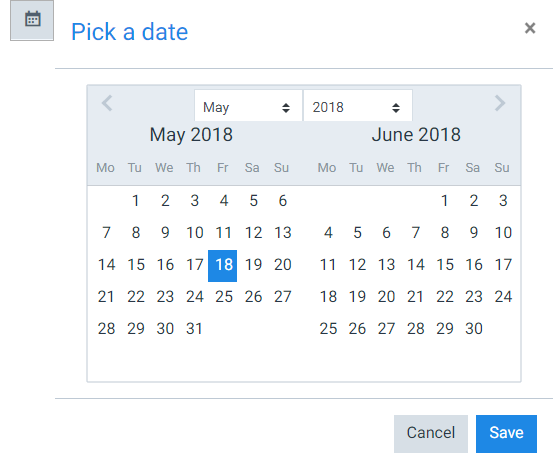
You'll get 1 or 2 date boxes, depending on your choice.

Use the date picker to select a date.
Procedures
You can export all the flow executions run within the project into one file (*.csv). This is ideal in scenarios where users would like to distribute data to relevant stakeholders to manage data efficiently.
| 1. | On the Reporting dashboard, select Export. |
| 2. | Select the All tab. |
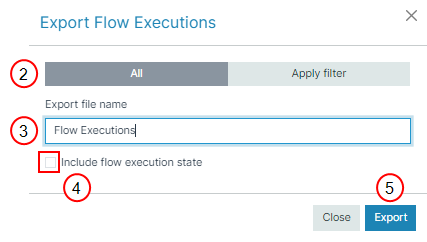
| 3. | Specify a file name for the export. |
| 4. | (Optional) Select Include flow execution state to include the flow execution state for the export. |
Selecting the Include flow execution state Option increases the file size exponentially. Unless you need detailed information about the state of an execution, we recommend to not checking the checkbox.
| 5. | Select Export. |
All the flow run data gets exported.
You can restart Smart Flows Flow Executions in any of the following statuses:
-
Error
-
Canceled
-
Warning
-
Interrupted
| 1. | Select the Control Panel button. |
The Control Panel page displays.
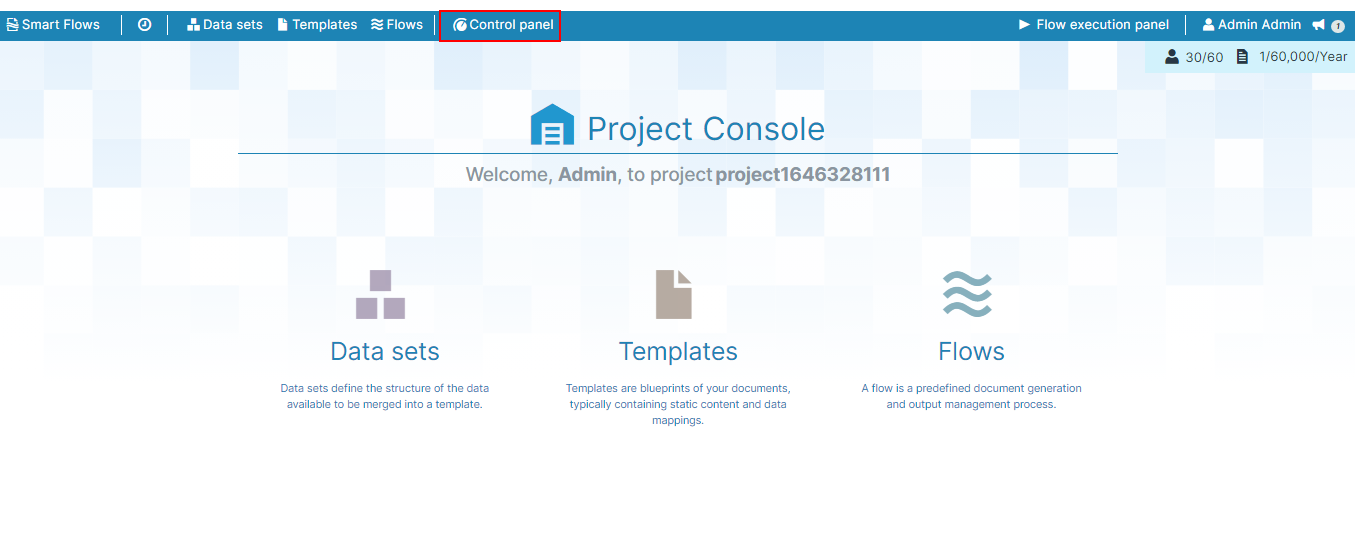
| 2. | From the Control Panel select Reporting. |
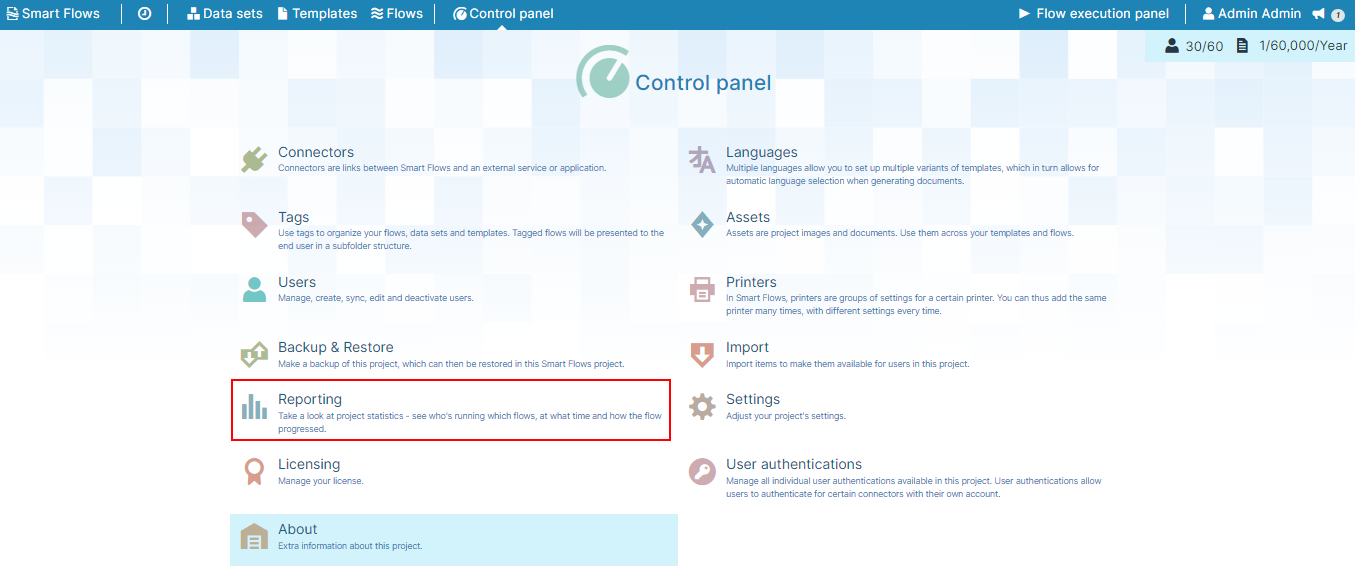
| 3. | From the left-hand navigation, select Recent flow runs. |
| 4. | In the Recent flow runs page, select a flow run with one of the given statuses mentioned above. |
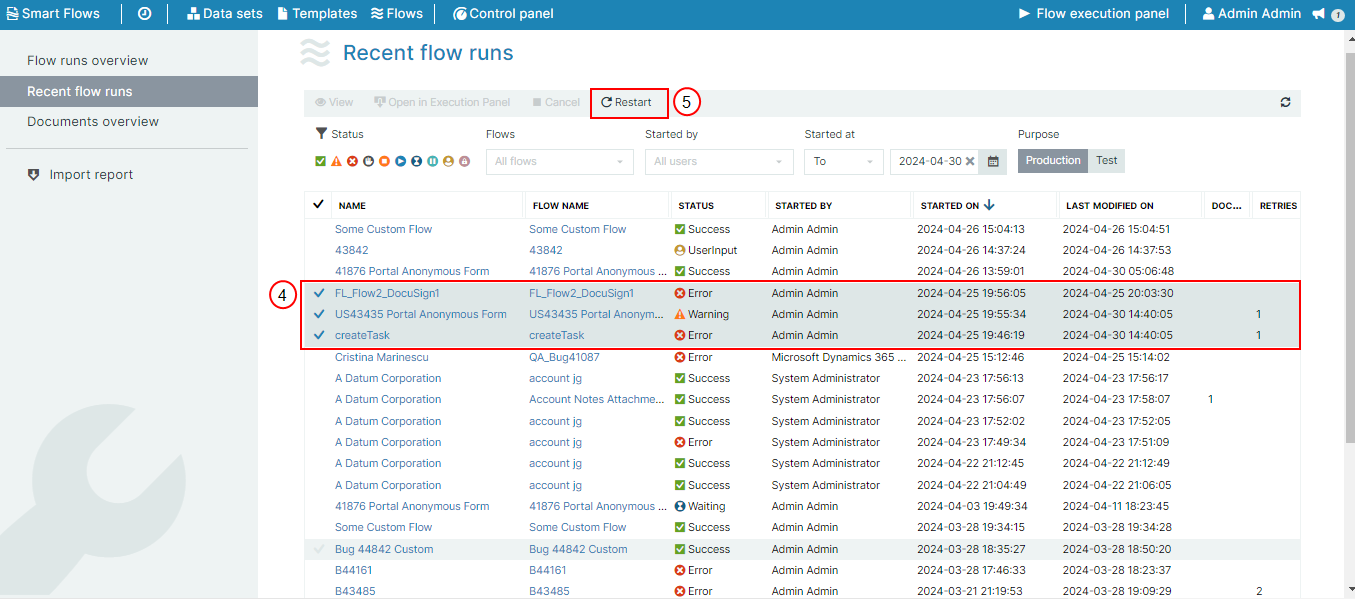
You can restart up to 100 flows at a time.
| 5. | Select Restart. |
Notice that the Status changes to Queued.
If you have more than one attempt you can see the information about each attempt inside the View modal on the left.